
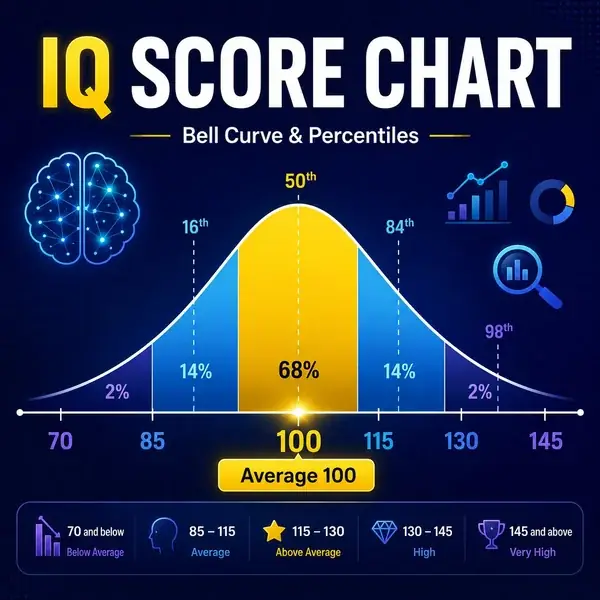
What is the IQ score chart?
An IQ score chart is a visual representation of how IQ scores are distributed across the population. It maps raw cognitive test performance onto a standardized scale where the mean (average) is 100 and the standard deviation is 15. This standardization makes it possible to compare one person's score directly to the general population, regardless of which IQ test they took.
The chart serves three main purposes. First, it shows where you fall relative to others — your percentile rank. Second, it groups scores into classification bands (Average, Superior, Very Superior, etc.) that translate cold numbers into meaningful labels. Third, it visualizes the bell curve — the bell-shaped distribution that emerges when you plot a large population's IQ scores.
Modern IQ scales like the WAIS-IV (Wechsler Adult Intelligence Scale) and the Stanford-Binet use this same chart structure. Online tests built on the ICAR framework follow the same norms. Once you understand how to read the chart, you can interpret any IQ result from any credible source.
The IQ bell curve, explained
The IQ bell curve — formally a normal distribution — is the most important concept on the chart. When you plot IQ scores from a large representative sample of people, you don't get a flat line or a random scatter. You get a smooth, symmetric, bell-shaped curve centered at 100.
The mathematical properties of the bell curve are remarkably consistent across the population:
- About 68% of people score within one standard deviation of the mean — between 85 and 115. This is the broad "Average" range.
- About 95% score within two standard deviations — between 70 and 130. This includes Low Average through Superior.
- About 99.7% score within three standard deviations — between 55 and 145.
- Only about 2% score above 130 (the typical Mensa qualifying threshold), and only about 2% score below 70.
This isn't a coincidence or a quirk of how tests are designed. Cognitive ability — like height, blood pressure, or many other biological traits — naturally tends toward a normal distribution when measured across a large population. The bell curve isn't created by the test; it's revealed by it.
Full IQ classification table
The standard WAIS-IV classification system divides IQ scores into seven bands. Each band corresponds to a description rooted in statistical position, not personal value.
| IQ Range | Classification | Percentile | % of population |
|---|---|---|---|
| 130+ | Very Superior | Top 2% | ~2.1% |
| 120–129 | Superior | Top 6–9% | ~6.7% |
| 110–119 | High Average | Top 16–25% | ~16.1% |
| 90–109 | Average | 25th–75th | ~50.0% |
| 80–89 | Low Average | 9th–25th | ~16.1% |
| 70–79 | Borderline | 2nd–9th | ~6.7% |
| Below 70 | Extremely Low | Bottom 2% | ~2.1% |
Note that the Average band covers a full 20 points (90–109) and contains half the population. This is by design: small differences within this range are statistically meaningful but rarely produce visible differences in everyday functioning. The bell curve is concentrated in the middle.
Score-by-score breakdown
Here's what each IQ range typically reflects:
IQ 145+ — Profoundly Gifted (Top 0.1%)
Extraordinary cognitive ability. At this level, individuals often show exceptional capacity for abstract reasoning, mathematical insight, and rapid learning. Many Nobel laureates and pioneering researchers test in this range. Statistically, only about 1 in 1,000 people score above 145.
IQ 130–144 — Very Superior / Gifted
The top 2% of the population. This is the Mensa qualifying range. Common among researchers, academics, doctors, engineers, and senior professionals. Strong abstract reasoning is the most reliable single marker of cognitive ability at this level.
IQ 120–129 — Superior
Well above average — roughly the top 10% of the population. People in this range tend to thrive in intellectually demanding fields and pick up new concepts quickly. Most STEM graduates, lawyers, and professionals fall here or higher.
IQ 110–119 — High Average
Above the population mean but not unusually so. This range is common among university graduates and people in knowledge-intensive roles. Strong functioning in most cognitive tasks.
IQ 90–109 — Average
The broad middle of the bell curve, where about half the population falls. A score here reflects solid, typical cognitive functioning — neither remarkable nor concerning. Most everyday tasks and standard education levels require IQ in this range.
IQ 80–89 — Low Average
Below the mean but within the normal range. People in this band may find highly abstract or fast-paced cognitive tasks more challenging but generally function well in everyday life and most jobs.
IQ 70–79 — Borderline
Significantly below average. This range may indicate difficulties with complex reasoning tasks. If accompanied by functional challenges in daily life, it could warrant evaluation by a clinical psychologist.
Below IQ 70 — Extremely Low
Scores in this range, when accompanied by significant limitations in adaptive functioning, may indicate intellectual disability. A comprehensive clinical assessment by a licensed professional is essential before any diagnostic conclusion.
IQ percentiles explained
A percentile rank tells you what percentage of the population scores below you. If your IQ is 115, you're at roughly the 84th percentile — meaning you scored higher than 84% of people. Percentiles can be more intuitive than raw scores because they translate the number into a population position.
Here are the key IQ–percentile conversions:
- IQ 70 → 2nd percentile
- IQ 80 → 9th percentile
- IQ 85 → 16th percentile
- IQ 100 → 50th percentile (median)
- IQ 115 → 84th percentile
- IQ 120 → 91st percentile
- IQ 130 → 98th percentile (Mensa threshold)
- IQ 140 → 99.6th percentile
- IQ 145 → 99.9th percentile
Notice the asymmetry: moving from 100 to 115 changes your percentile by 34 points, but moving from 130 to 145 only adds 1.9 points. The bell curve thins out fast at the extremes — that's why scores above 130 are so rare.
What is the average IQ?
By definition, the average IQ is 100. IQ scales are periodically re-normed precisely so the population mean stays at 100, with a standard deviation of 15. This means that about half of all people score between 90 and 110, and about 68% score between 85 and 115.
This is the "average IQ test score" — not because the test is calibrated to make everyone average, but because the scale is built around the population mean. When you score 100, you're scoring exactly at the median of the bell curve. There's no shame in average; statistically, average IQ is the most common outcome and reflects fully normal cognitive functioning.
It's worth noting that average IQ scores have been slowly rising over the 20th century — a phenomenon known as the Flynn Effect. This is why IQ tests are periodically re-normed: to keep "100" anchored to the contemporary population, not to historical norms.
What is a good IQ score?
This question depends on what you mean by "good." A score of 100 is perfectly average, and most people score between 85 and 115. Scores above 120 place you in roughly the top 10% of the population. Scores above 130 place you in the top 2% — the typical Mensa qualifying threshold.
But fixating on a single number misses the point. Real cognitive performance is multi-dimensional. Two people with the same overall IQ might have very different cognitive profiles — one excelling at verbal reasoning while the other dominates spatial tasks. That's why credible tests like our free IQ test provide a breakdown across four cognitive domains, not just a single number.
Also worth remembering: IQ doesn't measure motivation, conscientiousness, creativity, emotional intelligence, social skills, or persistence. Research shows that IQ has a moderate correlation with occupational success (~0.5), but personality traits like conscientiousness predict life outcomes nearly as well. A "good" IQ matters, but character matters at least as much.
Genius-level IQ (130+)
The term "genius IQ" doesn't have a single, official definition — it's a cultural label more than a clinical one. In common usage, genius-level IQ generally starts around 130 (the top 2% threshold), though some sources reserve the term for 140+ (roughly the top 0.4%) or 145+ (top 0.1%).
Historical figures often cited with extremely high IQs include Terence Tao (estimated 230), Marilyn vos Savant (228, listed for years in the Guinness Book), Christopher Hirata (~225), and William James Sidis (~250–300, though retrospective estimates are notoriously unreliable). At these extreme heights, the bell curve becomes statistically noisy, and tiny measurement errors translate into large apparent differences. Treat extreme scores with appropriate skepticism.
It's also worth noting that "genius" in any meaningful real-world sense — producing original creative or intellectual work — depends on much more than IQ. Persistence, domain expertise, opportunity, and a certain kind of intellectual curiosity matter at least as much as raw cognitive horsepower.